
Robot skill scaling laws: what it actually costs to train a manipulation policy
How success rate scales with demonstrations, and how to budget the data and compute for a new robot skill.
The short version
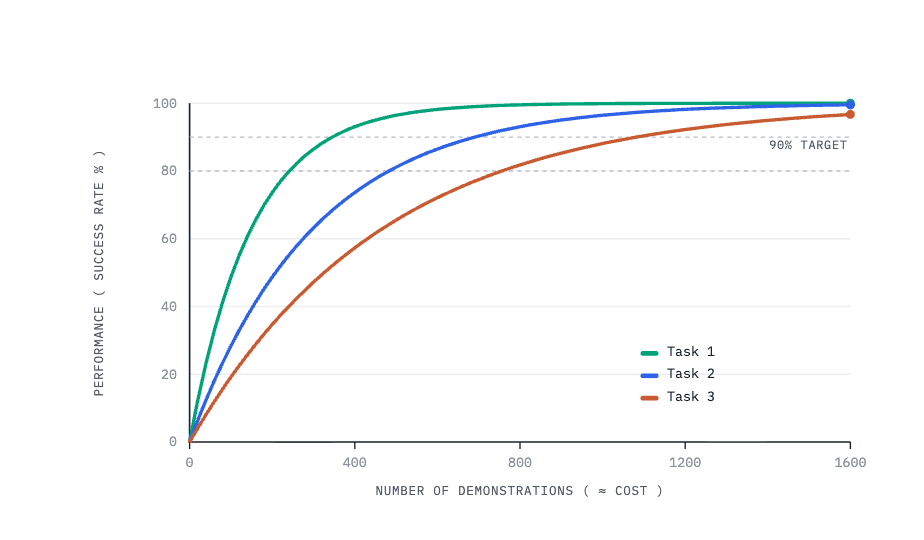
- Manipulation success rate rises with demonstrations, but with diminishing returns, early data buys huge gains, the last few points of reliability cost the most.
- The dominant cost in a robot manipulation dataset is human teleoperation time, not GPUs.
- Diversity of demonstrations beats raw count: 300 varied episodes usually outperform 1,000 near-identical ones.
“Scaling laws” for language models describe how loss falls predictably as you add data, parameters, and compute. Robot manipulation has a rougher, more useful version of the same idea: as you add demonstrations of a skill, the policy’s success rate climbs along a curve that bends. Knowing the shape of that curve is what lets you answer the only question that matters to a budget, how much data does this skill need before it’s good enough to deploy?
The shape of the curve
For a well-scoped manipulation task, success rate versus demonstration count looks like a saturating curve. The first tens of demonstrations take you from nothing to a policy that works in the easy cases. A few hundred typically get a single, well-defined skill into the 80–90% range. Pushing from 90% to 99% can take as many demonstrations again as everything before it, because those last points are the rare states: the odd grasp, the cluttered scene, the lighting you didn’t plan for. This is exactly the regime where teams stop adding demonstrations and switch to reinforcement learning fine-tuning to grind down the tail more cheaply than by collecting yet more human data.
Where the money actually goes
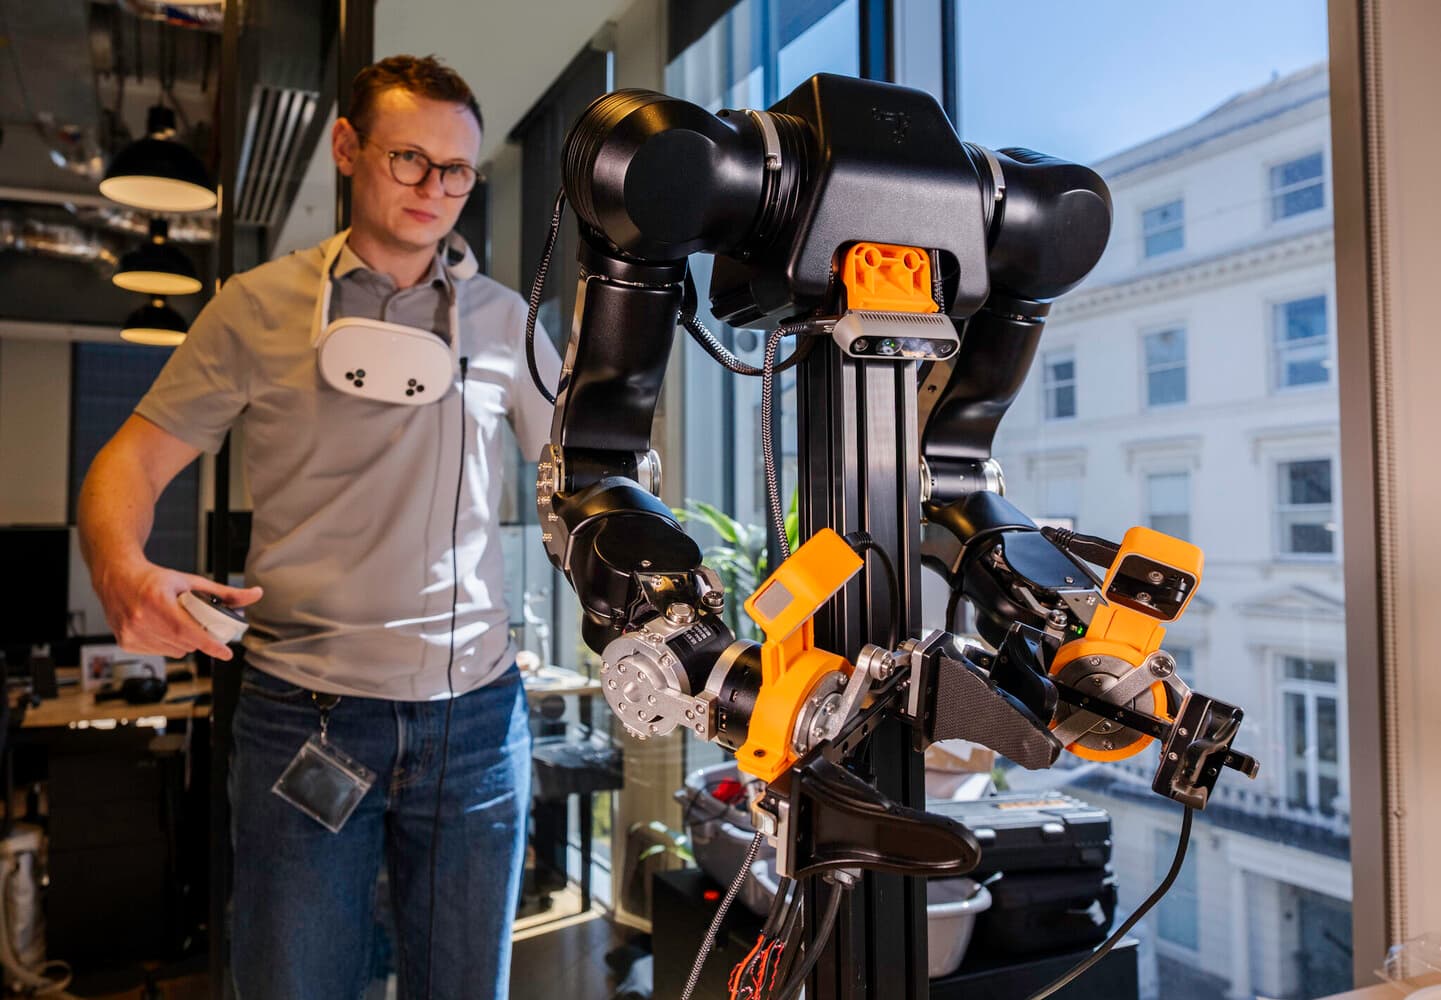
People assume training a policy is a compute cost. For manipulation it usually isn’t. Fine-tuning an imitation policy on a few hundred episodes is hours on a single GPU, real, but small. The expensive resource is human teleoperation time. Someone has to physically demonstrate the task, over and over, with enough variation to cover the states the robot will meet. At even a modest per-hour cost, collecting and cleaning a few thousand demonstrations dwarfs the training bill. That’s why the economics of a skill are set at data collection time, and why anything that makes collection faster or reduces how many demonstrations you need pays back immediately.
Diversity beats count
Not all demonstrations are worth the same. A thousand episodes of the same object in the same spot teach the policy one narrow slice of the world; three hundred episodes spanning object positions, orientations, distractors, and lighting teach it the distribution it will actually face. The steepest part of the scaling curve is climbed with variety, not volume. Practically, that means planning a collection protocol, randomize positions, rotate objects, vary the scene, rather than repeating the same tidy demonstration, and it means measuring coverage of your dataset, not just its size.
Cheaper ways up the curve
Three levers move the curve left, so you hit target success with less human data. Pre-training: starting from a VLA or a policy trained on related tasks means your demonstrations fine-tune rather than teach from scratch. Simulation: mixing simulated demonstrations adds coverage that would be costly to collect on hardware. Targeted collection: instead of blanket data, collect specifically in the states where the deployed policy fails, so each new demonstration buys the most reliability. All three are ways of spending human time where it counts.
The point of tracking this on a platform is that the scaling curve stops being folklore. When every demonstration, dataset version, and training run is logged together, you can actually plot success rate against data for your skills and forecast the next one, turning “we’ll collect until it works” into a number you can put in a plan.
More on building robot skills.
How robot data collection actually works
Teleoperation rigs, what a demonstration actually records, and how to keep the data trainable.
Read the article
Imitation learning vs. reinforcement learning
When to clone demonstrations, when to reward-optimize, and why most policies use both.
Read the article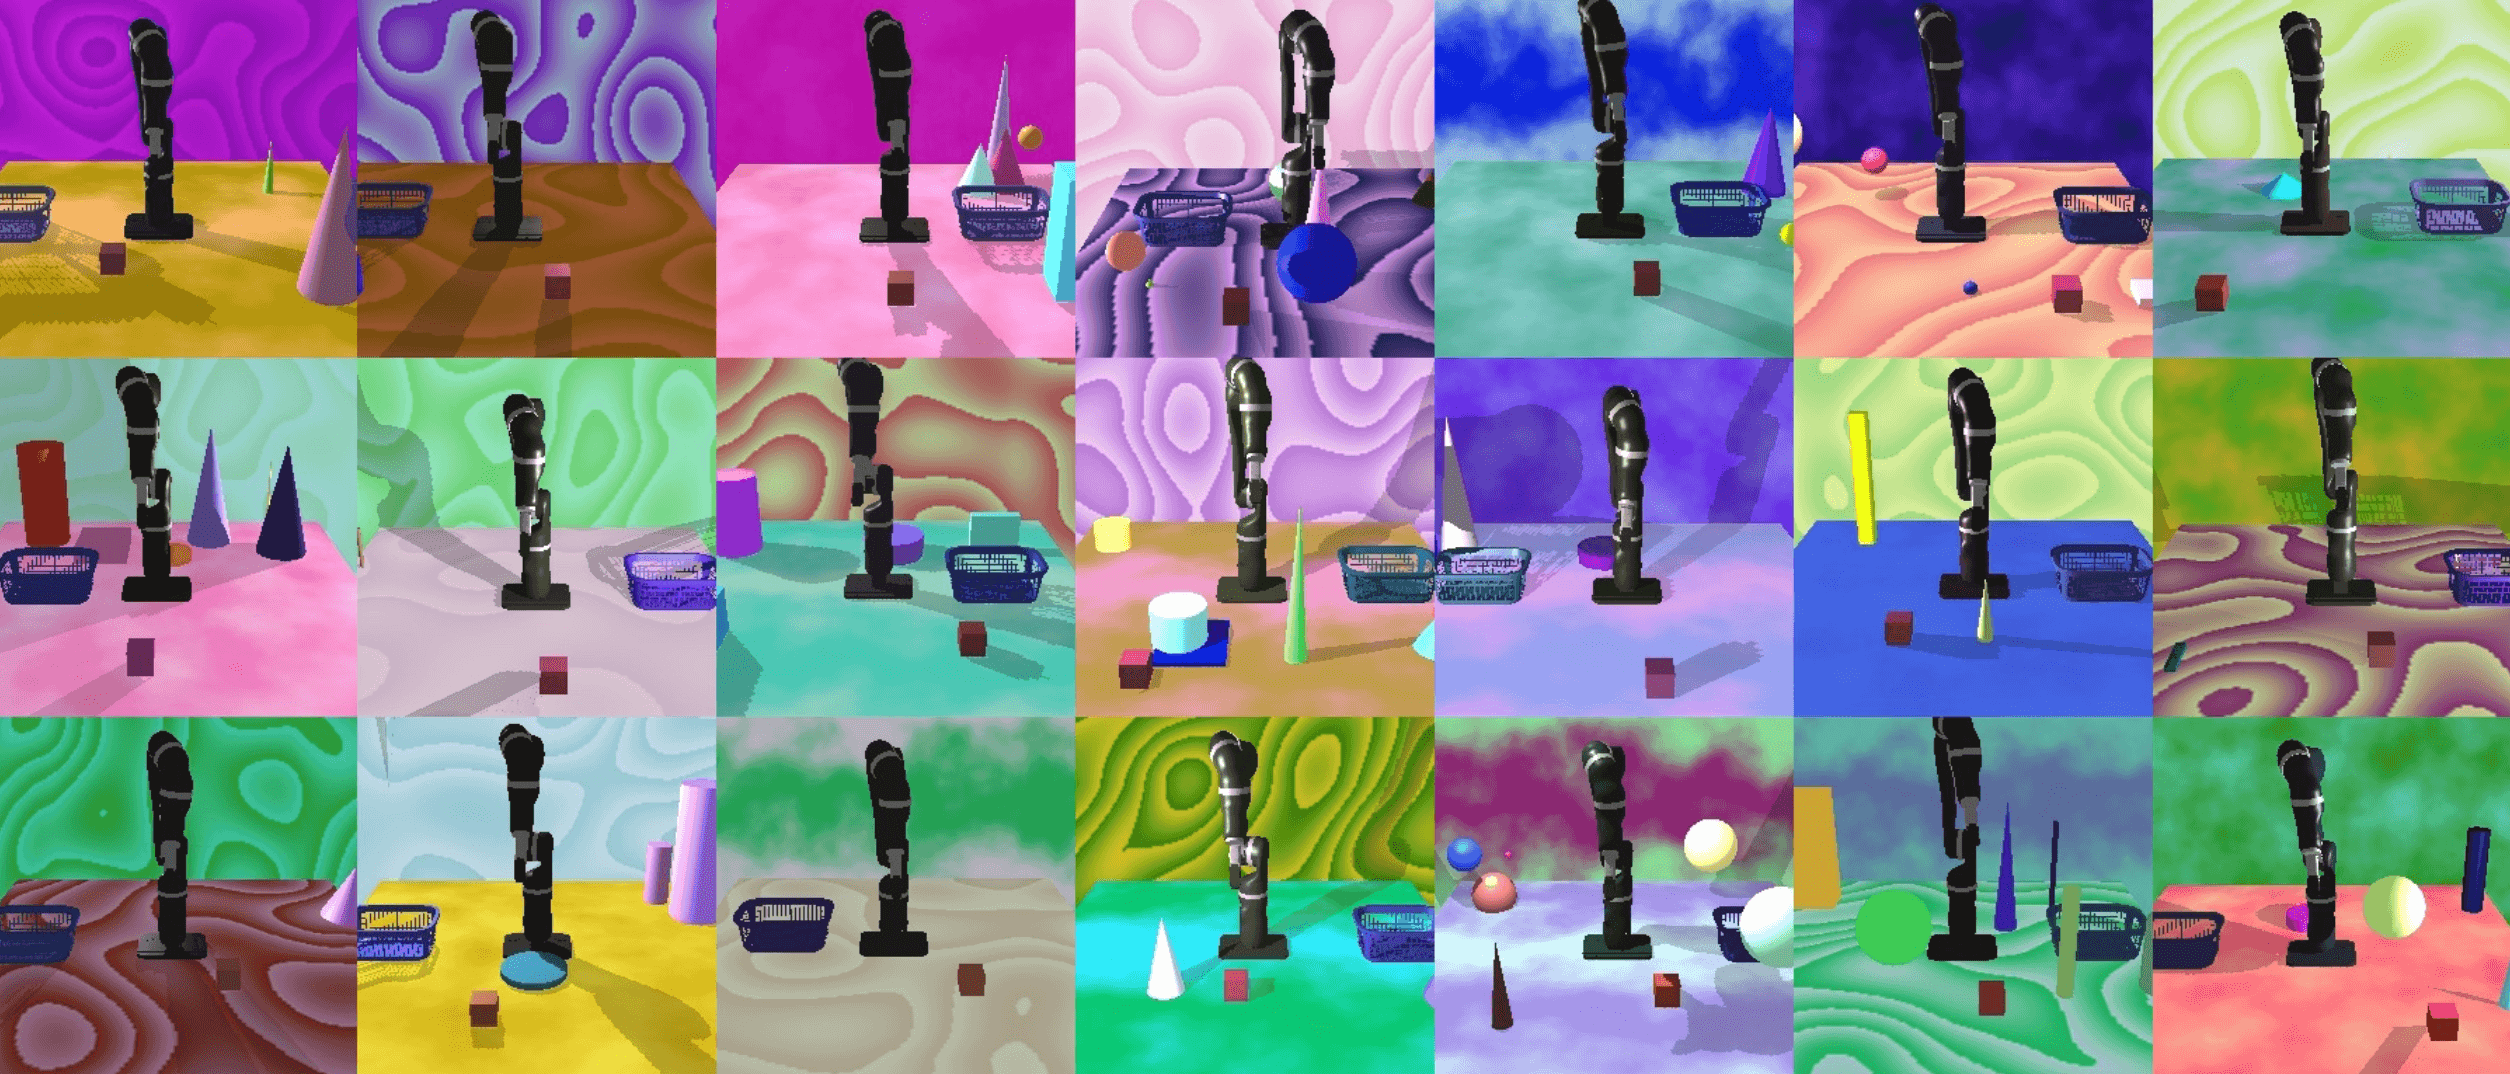
Sim-to-real: mixing simulated and real data
How much simulation helps, where it breaks, and how to blend sim and real rollouts.
Read the articleKnow what your next skill will cost.
Neuracore versions every demonstration and run, so you can plot the scaling curve for your own tasks and forecast the next one.